Single open queue
| This blog is part of a series dedicated to queuing theory. In the Series page you can find all the posts of the series. |
This blog I am writing more about a simple queue I started in previous blogs, see the section of related posts below. The simplest queue that represents the minimal unit to model large number of systems is the Erlang-C model (aka M/M/N queue)1. This model is the one defined in the previous post2 in where it assumes:
- customers arrive at rate $\lambda$ following a Poison process3
- customers service time following an exponential distribution with rate $\mu$4
The main input parameters of the model are therefore the number of servers $N$, the arrival rate $\lambda$, and the service rate $\mu$. The most important result of queuing theory is then to derive the average for all performance indicators for this model5:
- number of busy server: $n = x$
- throughput in units of $\mu$: $X = n = x$
- server utilization: $U = n/N = x/N$
- number of customer in queue: %%q = C_N(U) \frac{U}{1-U}%%
- number of customer present in the system: $p = q + n$
- queue waiting time in units of $\mu^{-1}$: %%w = C_N(U) \frac{1}{N(1-U)}%%
- total time a customer is in the system or response time units of $\mu^{-1}$: $ R = w+1 $
All these quantities depend on the offered load $x = \lambda/\mu$ and Erlang-C function defined as
\[C_N(U) = \left[ U + (1-U) \frac{N!}{(UN)^N} \sum^{N}_{k=0} \frac{(UN)^k}{k!}\right]^{-1}\]that it gives the probability for a customer to be delayed in the queue upon arrival. This is equivalent to say the probability that the number customers in the system $p$ is larger than number of servers $N$ or $\text{Prob}(p > N) = C_N(U)$.
Although the model has three parameters $\left(\lambda, \mu, N\right)$, its behavior is determine mostly by two independent parameters $\left(\lambda/\mu, N\right)$, in where $\mu$ is a constant that fix the unit of time.
My goal in this post is to introduce the primary results and notation that I will be using when discussing queues. In the referent section of this post, you can find references for more detailed discussions and deduction of these relationships. As program assignment, I implemented a simple MATLAB function to calculate model’s results. I also validated the result from the model against simulation as explain below. Erlang-C function was implemented by Brian Borches and its code can be download from MathWorks’ File Exchange.
The way I like to show any system performance is by given the response time $\left(R\right)$ and system throughput $\left(X\right)$ as a function of a proxy of the system load. For a single open queue, I like using the server utilization $U$ as a proxy. The simplicity of this queueing model implies that throughput and utilization are trivially related by $X = N\left(U \wedge 1\right)$. This means that performance grows when more servers are use until they are all busy. The non-trivial result of this model is the response time. The following plot show single queue response time computed using the Erlang-C model and a simulation of an Erlang-C queue.

The simulation was implemented in SimEvent6 using a derived model of M/M/1 simulation example7. I modified the model to allow more than one server, and I measured the time takes a customer to enter and to exit the system (aka the response time)8. The following figure shows the resulting SimEvent model after the modifications.
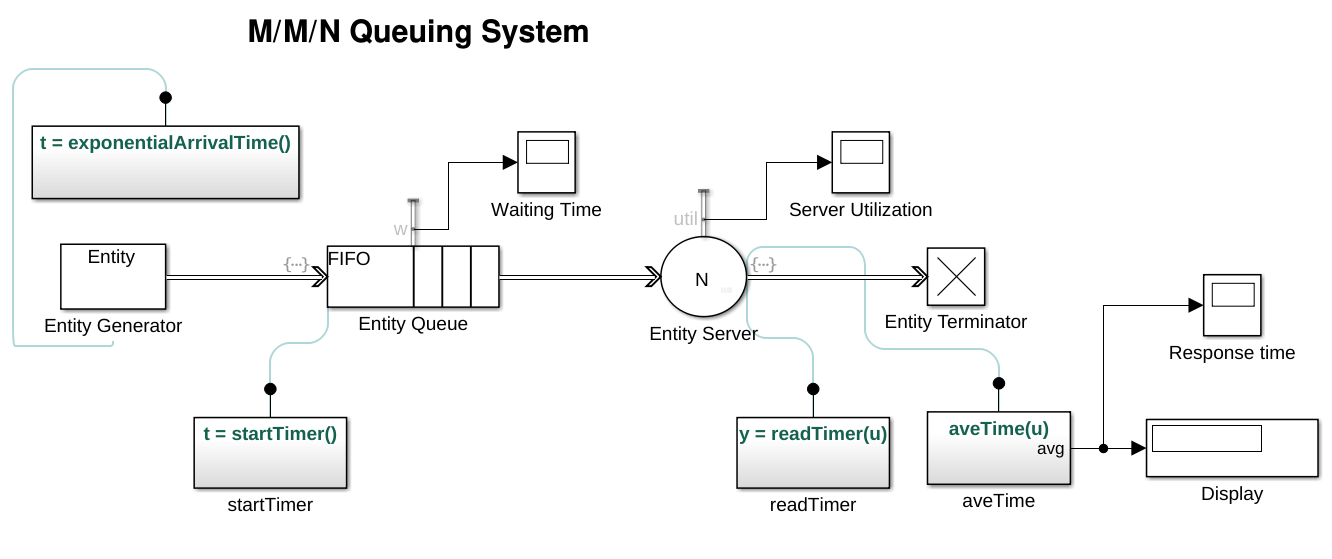
For the simulation runs, I set the number of servers $N = 10$ and $\mu = 1$. I scanned the value of $\lambda_i = 1 - 10^{-v_i}$ where $v_i = 0.1,0.2,…,1.4$. This non-linear sampling have a better resolution at $U \approx 1$. The simulation is run by 40K time steps and the average response time is used in the plot.
The figure shows that this simple model matches pretty closely with the simulation. From this post forward, I will assume the validity of the model and the code. Next, I am planning to discuss the behavior of a single queue with a large number of servers, a significant case that I call single open queue at scale.
Program assignment or examples
References

Note of a interdiciplinarian by Victor E. Bazterra is licensed under a Creative Commons Attribution-NonCommercial-NoDerivatives 4.0 International License.